2018/08/28
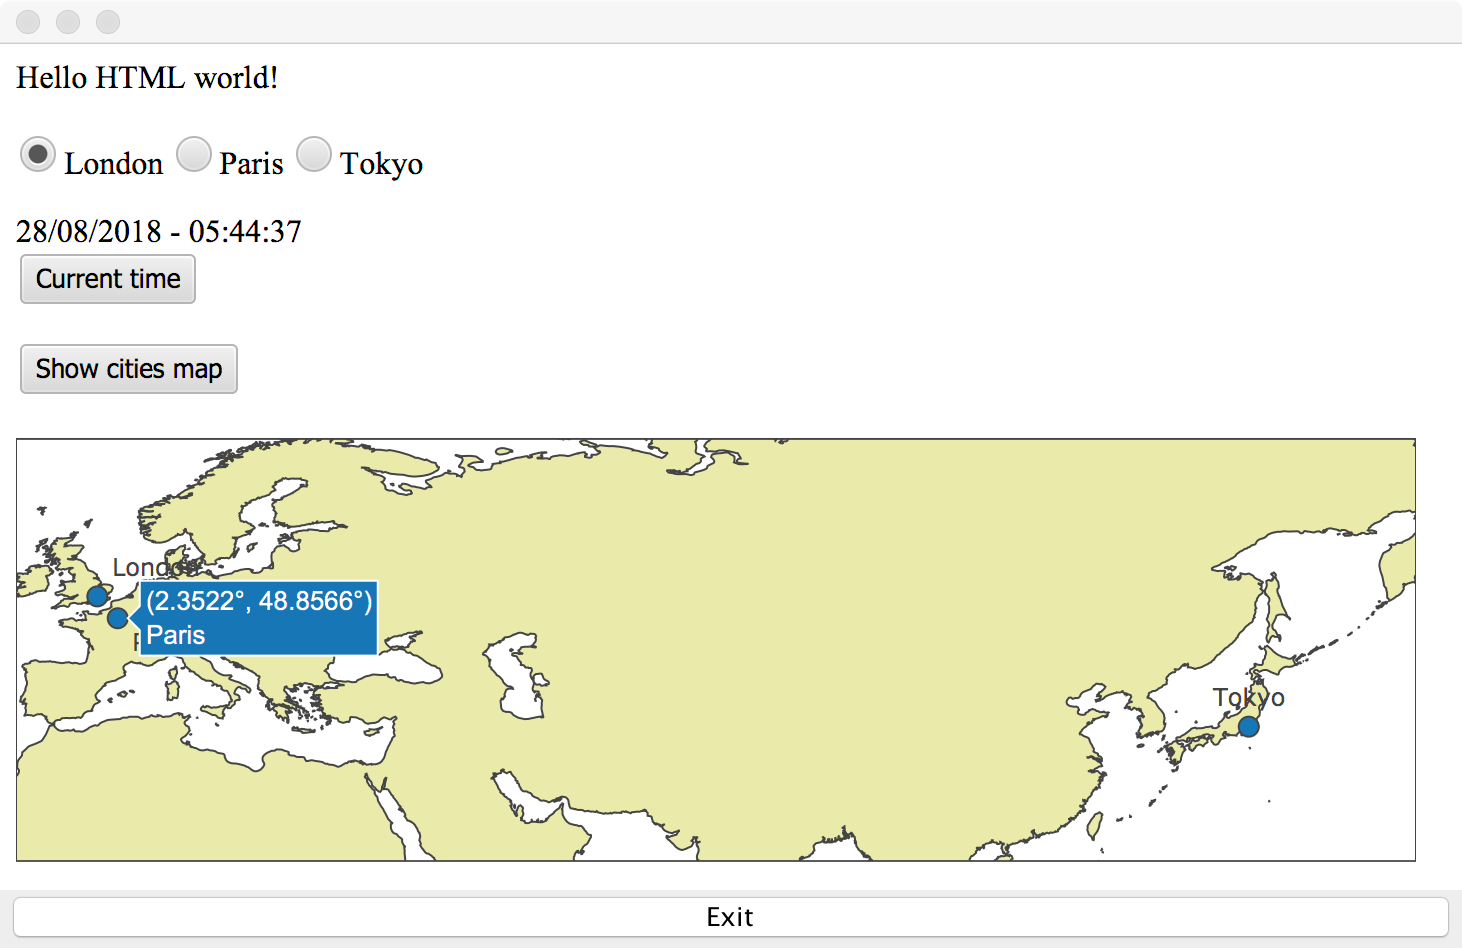
In the previous article we added a time zone selection on our clock. Now, let's show those cities on a map! In order to do this I'm going to use the popular plot.ly library.
On the HTML side we need a div where the chart will be injected and a button to click:
        <button data-bind="click: $root.showPlot">Show cities map</button>
        <div id="plot"></div>
Next, we need to include the plot.ly Javascript file. We use the @JavaScriptResource annotation:
        @JavaScriptResource("plotly-latest.min.js")
        public class Clock {
        ...
Note that plotly-latest.min.js is a resource added in our Java package.
The HTML button calls showPlot which is a new method in our Clock class:
        @Function
        static void showPlot(ClockModel model) {
             newPlot("plot", createGeoData(new String[]{"London", "Paris", "Tokyo"},
                     new double[]{51.5074, 48.8566, 35.6895},
                     new double[]{-0.1278, 2.3522, 139.6917},
                     new String[]{"top right", "bottom right", "top center"}),
                     createGeoLayout());
       }
Note the @Function annotation. This method calls newPlot, createGeoData (which receives the list of cities and coordinates) and createGeoLayout.
newPlot is quite simple:
        @JavaScriptBody(args = {"divName", "data", "layout"}, body = "Plotly.newPlot(divName, data, layout, {displayModeBar: false})")
        public static native void newPlot(String divName, Object data, Object layout);
It just calls from Javascript the Plotly.newPlot method with the given arguments. Since this is something executed from the Javascript side, it is a native method and has a @JavaScriptBody.
How interesting to use the native modifier for this!
createGeoData creates the plot.ly configuration object based on the given arguments and it's again native:
        @JavaScriptBody(args = {"cities", "lat", "lon", "textPosition"}, body = "return [{\n" +
    "        type: 'scattergeo',\n" +
    "        mode: 'markers+text',\n" +
    "        text: cities,\n" +
    "        lon: lon,\n" +
    "        lat: lat,\n" +
    "        marker: {\n" +
    "            size: 10,\n" +
    "            line: {\n" +
    "                width: 1\n" +
    "            }\n" +
    "        },\n" +
    "        name: 'Clock cities',\n" +
    "        textposition: textPosition,\n" +
    "    }]")
        public static native Object createGeoData(String[] cities, double[] lat, double [] lon, String[] textPosition);
createGeoLayout is the least interesting as it just creates a static object with the chart properties:
        @JavaScriptBody(args = {}, body = "return {\n" +
    "        autosize: false,\n" +
    "        height: 220,\n" +
    "        margin: {\n" +
    "            l: 0,\n" +
    "            r: 0,\n" +
    "            t: 0,\n" +
    "            b: 0,\n" +
    "            pad: 0\n" +
    "        },\n" +
    "        geo: {\n" +
    "            scope: 'world',\n" +
    "            resolution: 50,\n" +
    "            lonaxis: {\n" +
    "                'range': [-10, 160]\n" +
    "            },\n" +
    "            lataxis: {\n" +
    "                'range': [20, 70]\n" +
    "            },\n" +
    "            showland: true,\n" +
    "            landcolor: '#EAEAAE'\n" +
    "        }\n" +
    "    }")
        public static native Object createGeoLayout();
That's it! As usual the full project is available at https://github.com/emilianbold/nbwt-clock-demo